


In the post-truth era, lying takes on a special flavor. In a historical moment in which more facts can be checked than ever before and everything is verifiable, it is not easy to lie.
But in this article we will discover through examples and valuable observations that it is possible not only to be deceived by manipulated data, but also to be unintentionally deceived by dirty or low-quality data.
You don't need to be a scientist, a mathematician, or a connoisseur of STEM fields to understand that, many times, well-told stories can strip away the neutrality of numbers and make even the most skeptical believe a fallacy.
Working with data in search of insights, directions, trends, and truths, therefore, must be followed by the hability to "smell rats" and hire qualified people, even more in the era of Big Data - which can further intensify this problem.
The fact is: although data can be treacherous, there is no alternative but to decipher it. According to a survey by New Vantage Partners this year, investment in data and AI initiatives is on the rise: 97% of responding companies are investing in data solutions and 91% in AI. Among them, 92.1% report that they are achieving positive, measurable results by 2022, compared to 48.4% in 2017 and 70.3% in 2020. However, organizations still face challenges in their efforts to become data-driven.
Next, we will understand how every good lie told with data needs to be largely a truth. It sounds contradictory, but we will see that it makes sense.
Data traps: learn about 5 dangerous interpretations
One should not simply accept an idea just because it is surrounded by numbers. Author Darrell Huff, in his classic book "How to Lie with Statistics", understands the reasons for this uncritical acceptance and reveals some dangerous interpretations that are often presented about data.
Here, we will put them in a business context.
1. Biased sampling
When information is obtained from a small or inappropriate sample, the research result can be biased.
For example, in a retail company, a CIO is determined to use predictive models and artificial intelligence to understand buying trends and thereby rethink purchasing for inventory, suppliers, and other logistics variables.
However, instead of working with deep segmented data of her customers, and the region where the brand operates, she goes for a national sample from a purchased database to define the most competitive product.
Unless this is a first step towards brand expansion, this is a risky bet, since the national sample is random and tends not to get as close to the reality of the company's customers.
Biased samples are the most common in randomly purchased databases, because variables such as income, political opinion, education, neighborhood, consumption habits, among others, can completely change the result.
2. The well-chosen average
Whether a study is interested in getting you to agree or disagree with a fact using an arithmetic, median, or modal average - the choice of the average will make all the difference.
Let's suppose that an insurance company is conducting a survey about the average income of a neighborhood in order to improve the accuracy of its quotes. If a broker doesn't interpret the data correctly, he may end up losing clients because he is based on a value such as: $15,000, $3,500, or even $7,000.
All of these may be correct, but by not making a personalized quote per client, or even, by not clustering them in closer income values, the broker ends up being deceived and harmed by the numbers.
In this case, R$15 thousand is the arithmetic average. That is, the sum of all the incomes and their division by the number of families in a neighborhood. The median corresponds to R$3,500, since it is understood that half the families earn more than this amount; and the other half, less. And the modal average of R$7,000 refers to the number most frequently found in the total number of families.
3. The hidden numbers
Did you know that 80% of the time when we flip a coin, the result will be tails? Actually, that happened now that I tossed a coin 10 times, and for 8 times the result was tails.
So where is the problem? The sample size is too small and, in fact, the correct probability is 50% that it is heads or tails.
If we think that a bank is using a weak predictive model when evaluating customers to decide whether or not to grant a loan, an opportunity may be missed if it considers a sample too small or outdated.
That is, with a poor data sample and a poor predictive model, we only observe that 1x time a customer has stopped paying his credit card, therefore he is a bad payer and doesn't get the loan.
With quality work, we can discover that, among all the invoices, this debt occurred in 2001, was paid off in the same year, and even that this customer now has high-value assets in his name.
4. The semi-connected number
When the one thing desired cannot be proved, something else equivalent is shown. When we really want something to be true, we can make false associations even if unintentionally.
Let's imagine that a hotel chain wants to run a promotion for families claiming to be 'the hotel preferred by children'. If the hotel relies on a regional union survey that found that it was the hotel that received the most children in 1 year, and doesn't look at any data from its own research or NPS via Wi-Fi, it may end up not seeing the wrong association it made and damage its reputation.
This is because having received more children quantitatively does not mean that the hotel has areas and rooms designed to prevent accidents, has toys and recreations, or in fact customer reviews favorable to that slogan.
However, this may be an opportunity to understand a niche market that better serves it, and invest in improvements focused on new business directions.
5. Coincidental Correlation
This is one of the oldest fallacies! But it is very likely to appear in statistical and data materials. Basically, it occurs when they say that if B happened after A, then A caused B. In other words, it is a false cause and effect link.
For example, a chain of fitness centers notices a decrease in membership and a gradual departure of many members, in a short period of time, and links it to the end of summer. Using this seasonal fact as a justification is the easiest and most obvious alternative.
However, cross-referenced data could show that that part of town has started to have a very large increase in young residents, and that the new class schedule does not match their profile.
What to do when data is the problem?
Even raw data, before any sanitization or treatment, before it generates insights, also contains lies. And with poorly structured and dirty data, no matter how good the analysis is, it will come to a false conclusion.
And this condition is what turns obvious truths and trends into confusing and contradictory investment paths. When dirty, low-quality data is a problem, the source usually lies in the following processes.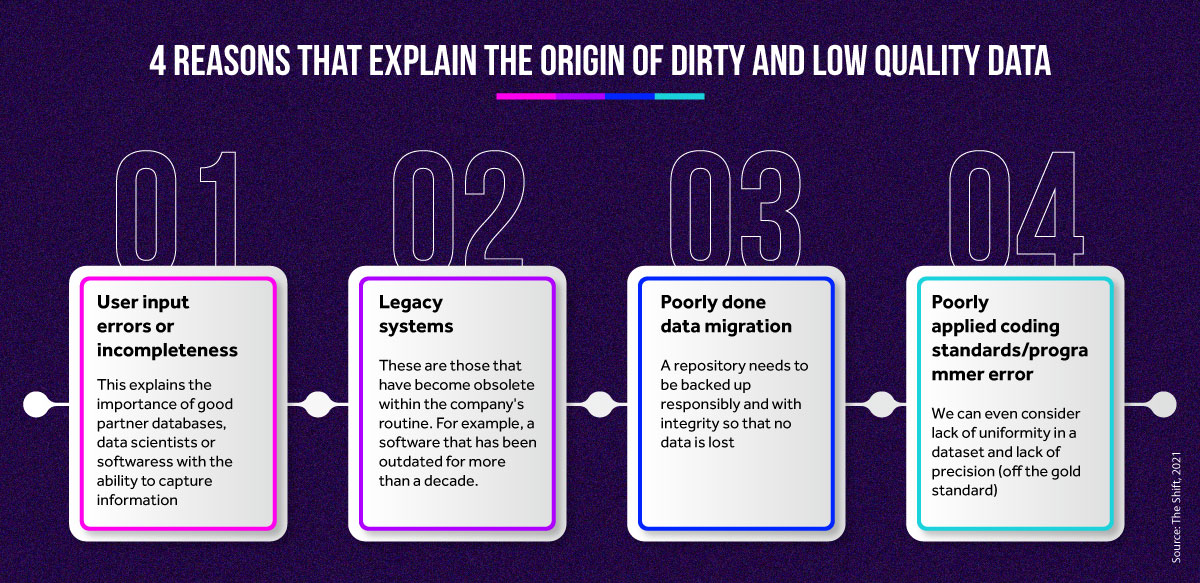 And in order not to make these mistakes and thereby achieve good data analysis, your raw material must be well taken care of so as not to guide your company into traps and also to allow an accurate and correct interpretation of reality.
To sanitize and treat data, there are some smart and very useful methodologies, in the opinion of IBM's Big Data Evangelist James Kobielus. Among them,
- Ensemble learning: this is useful for finding out whether different models converge on the same statistical pattern. That is, if they, using the same group of data, but with different samples and different algorithms, arrive at results that make sense.
- A/B Test: this is when 2 models are used at the same time with different variables, but at the same constant. When the results come in, we can tell which model is more accurate with respect to the variable of most interest.
- Robust modeling: if the predictions made are stable and work with partner databases for complementation, they are part of a robust modeling - the danger of this approach is that you end up hiding even more patterns or end up surprising with new models.
And how not to fall for lies using data?
While knowing that the ideal is to really become data literate - to know how to do a good job of reading, interpreting, and making decisions from it - you don't have to be a scientist to learn to be suspicious of manipulated data, misleading insights, or poor information.
In Huff's book, he lists 5 questions to ask yourself before thinking about trusting information gained from data.
- Who is saying this?
- How does this person know this?
- What is missing?
- Has someone changed the subject?
- Does this make sense?
In the 1st question, the author encourages investigation regarding the origin of the information. In the 2nd, the questioning is about the methods used, the sample observed. In the 3rd question, the central point is the interpretation of the results, whether it is partial or not.
The fourth question aims to understand the interests involved. That is, if those who did the research might wish to obtain a specific result. And finally, in "Does this make sense?", the issue is the legitimacy of the result.
In short, uncomfortable questions must be asked to prevent fallacies from leading managers or even an entire company to failure. The union must be between investments in state-of-the-art technology, qualified software and robust databases, and good analysis and business teams.
Want to learn more?
To deepen your knowledge about predictive models, machine learning and artificial intelligence, download our free eBook on Sentiment Analysis, one of the latest and most powerful resources for identifying behavioral data.


Comments